CEH M03-04 | Open, Closed, Filtered: Turn Port States into Evidence-Based Judgments
In one sentence: a port state interprets the response obtained from this location, with this method, in this test; recording the state alongside its response evidence helps you choose the next verification step.
The previous unit introduced TCP Connect, SYN, and UDP scans. Today we focus on interpreting results: when we see open, closed, or filtered, how can we understand and document them and use them to validate our own services and firewall settings?
1 | Start with extensions in an office building
Imagine calling an office building:
- Someone answers the requested extension: a service is available along this communication path.
- The switchboard explicitly says nobody currently answers that extension: you have received a concrete rejection response.
- The switchboard blocks external calls according to policy: you are observing an access policy's effect; you can check its access conditions with the administrator next.
A port can initially be understood as an extension number through which a network program receives communications. An IP address (Internet Protocol address) helps packets reach a network endpoint; the transport protocol and port further distinguish the communication method and service entry point.
For example, “TCP 443 on 192.0.2.20” and “UDP 443 on 192.0.2.20” are two entry points to check separately. TCP stands for Transmission Control Protocol; UDP stands for User Datagram Protocol.
All addresses and scenarios in this lesson are synthetic teaching examples. Practical work remains within your own isolated lab and equipment approved in advance.
2 | Distinguish the three core states first
Nmap is a network discovery and security auditing tool. It classifies ports according to the probe method and responses. This lesson focuses on three states:
| State | Plain-language meaning | What does the administrator check next? |
|---|---|---|
| open | The probe indicates that a service accepts the corresponding communication at this entry point | Service purpose, authorized users, version, and protection settings |
| closed | A definite response leads the tool to classify the entry point as having no listening service | Whether the expected service is running and bound to the correct location |
| filtered | Probe results fit a filtering situation; other evidence will clarify whether the entry point is open | Firewall rules, the path, and related records |
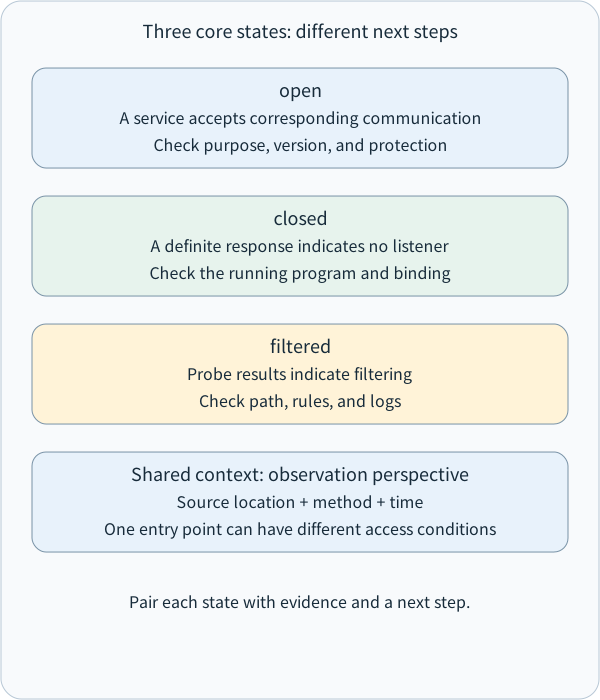
The key is the observation perspective. The same management entry point can accept connections from a management subnet while probes from other subnets are filtered. Both results can be correct: each describes its own access conditions. Nmap: port states
Writing “TCP 443 tested open from the management subnet” makes a result easier for others to reproduce and verify than simply writing “443 is open.”
Parallel categories and observation conditions, with no flow arrows.
The whole diagram scales proportionally to this column. Small screens also shrink its text; open the original SVG to zoom, or read the explanation below.
- How to read the diagram
- Parallel categories and observation conditions, with no flow arrows.
Parallel cards compare categories; their order does not imply a process.
open
A service accepts corresponding communication
Check purpose, version, and protection
closed
A definite response indicates no listener
Check the running program and binding
filtered
Probe results indicate filtering
Check path, rules, and logs
Shared context: observation perspective
Source location + method + time
One entry point can have different access conditions
Pair each state with evidence and a next step.
3 | TCP SYN scans: read three states from responses
SYN is the TCP flag used to initiate a connection; ACK indicates acknowledgment; RST is the connection-reset flag. A flag is a field in a packet that expresses a control meaning.
For an ordinary TCP SYN scan, this table explains common results:
| Probe sent | Response observed | Common classification |
|---|---|---|
| SYN | SYN/ACK: the peer responds to the connection request | open |
| SYN | RST: a reset response | closed |
| SYN | Still no response after retries, or certain unreachable messages | filtered |
ICMP stands for Internet Control Message Protocol, which carries control information such as network errors. For example, an ICMP response indicating that communication is administratively prohibited can help explain restrictions along the path.
Nmap's SYN scan maps received messages to states; retries and waiting are part of that interpretation process. Therefore, preserve the scan method when recording results. Nmap: TCP SYN scan
A useful reading habit: put “received RST” in the observation column and “Nmap classified it as closed” in the interpretation column, then check the device's listening-service state. This connects network responses to device settings.
TCP defines processing rules for RST, and network devices can also generate responses according to policy. Checking the response source, host records, and firewall records helps establish the cause. TCP specification: RFC 9293
Parallel comparison of three common SYN-scan responses and recording practice.
The whole diagram scales proportionally to this column. Small screens also shrink its text; open the original SVG to zoom, or read the explanation below.
- How to read the diagram
- Parallel comparison of three common SYN-scan responses and recording practice.
Parallel cards compare categories; their order does not imply a process.
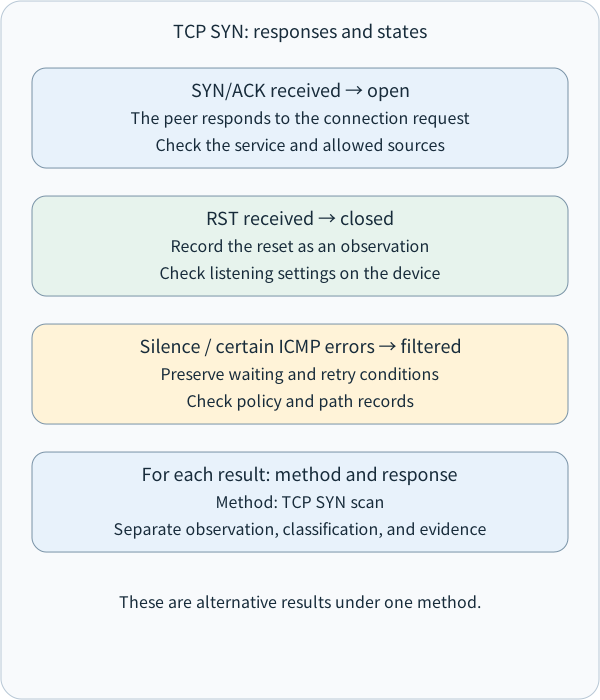
SYN/ACK received → open
The peer responds to the connection request
Check the service and allowed sources
RST received → closed
Record the reset as an observation
Check listening settings on the device
Silence / certain ICMP errors → filtered
Preserve waiting and retry conditions
Check policy and path records
For each result: method and response
Method: TCP SYN scan
Separate observation, classification, and evidence
These are alternative results under one method.
4 | UDP silence keeps two possibilities open
UDP sends messages as datagrams without TCP's connection-establishing three-way handshake. After receiving data, an application may reply, or it may process only requests matching its expected format.
That makes open|filtered particularly important when reading UDP scans. Here, the “|” separates two candidate states: open, or filtered.
| Observation after a UDP probe | Common Nmap classification | Next verification step |
|---|---|---|
| A corresponding UDP response | open | Check the response content and service settings |
| IPv4 ICMP “port unreachable,” Type 3 / Code 3 | closed | Check the program listening at that entry point |
| Other ICMP errors that meet the filtering criteria | filtered | Check the path and policy |
| Still no response after retries | open|filtered | Compare service logs, firewall logs, and a suitable service-specific test |
For example, a UDP service that processes only a particular data format may remain silent when the probe does not match it; a firewall dropping the probe may produce the same visible result. Keeping both candidates tells us what kind of evidence to gather next. Nmap: UDP scan
Read the scan method first, the response second, and the state last. This order explains why a TCP SYN timeout is commonly classified as filtered, whereas a UDP timeout is commonly classified as open|filtered.
Parallel UDP-response categories; silence preserves two possibilities.
The whole diagram scales proportionally to this column. Small screens also shrink its text; open the original SVG to zoom, or read the explanation below.
- How to read the diagram
- Parallel UDP-response categories; silence preserves two possibilities.
Parallel cards compare categories; their order does not imply a process.
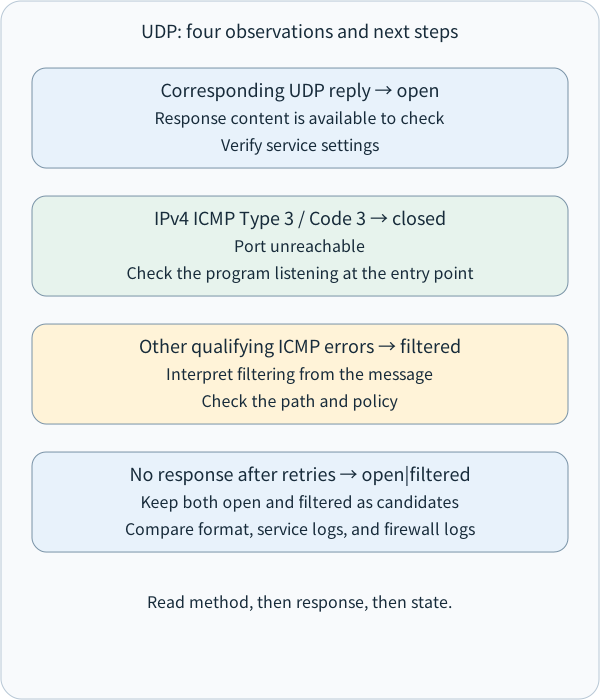
Corresponding UDP reply → open
Response content is available to check
Verify service settings
IPv4 ICMP Type 3 / Code 3 → closed
Port unreachable
Check the program listening at the entry point
Other qualifying ICMP errors → filtered
Interpret filtering from the message
Check the path and policy
No response after retries → open|filtered
Keep both open and filtered as candidates
Compare format, service logs, and firewall logs
Read method, then response, then state.
5 | Two other labels: understand the question they answer
Alongside the three core states and open|filtered, Nmap has two further states:
- unfiltered: the probe has not encountered filtering as observed by that method. ACK scans commonly use this classification to describe a probe receiving a response; an appropriate additional method checks whether a service is open.
- closed|filtered: closed or filtered. This classification is used by the particular IP ID idle-scan technique. For this unit, remember that it also preserves candidate states.
ACK scans examine filtering-rule behavior; SYN scans help distinguish open, closed, and filtered ports. They ask different questions, so read each result together with its method. Nmap: scan techniques and classifications
Memory aid: open concerns a service accepting communication, closed a definite rejection response, and filtered a filtering interpretation; labels containing “|” preserve two verification directions.
6 | Read a complete synthetic case
Suppose you are assigned to validate a lab test server. Prior approval limits checks to TCP 443, TCP 8443, and UDP 53, with two observation locations: the management subnet and an ordinary test subnet.
Here are the teaching example's summarized results:
| Location / method | Entry point | Response evidence | Classification |
|---|---|---|---|
| Management subnet / SYN | TCP 443 | SYN/ACK | open |
| Ordinary test subnet / SYN | TCP 443 | No response after retries | filtered |
| Management subnet / SYN | TCP 8443 | RST | closed |
| Management subnet / UDP | UDP 53 | No response after retries | open|filtered |
Next, organize them around the task's purpose:
First, TCP 443 produces different results from the two observation locations. If the requirement was “management-subnet access only,” this is a useful lead for further validation. The administrator can compare allow and deny rules and logs from around the test time.
Second, TCP 8443 is closed. If the service should run there, check whether its program is running, listening on that port, and bound only to a particular interface. If no service was planned there, compare the result with the asset inventory.
Third, UDP 53 remains open|filtered. DNS stands for Domain Name System. If the device is expected to provide DNS, use an approved query in the service's expected format and compare DNS and firewall records, letting the next evidence resolve the remaining question.
The lesson from this case is: a state is a signpost for verification work, rather than a rating. Each result points to a clear next step.
7 | Write scan reports others can reproduce
A useful record includes at least:
1. Target and authorized scope: device, IP address, transport protocol, port, and approved purpose.
2. Observation conditions: source subnet, date/time and time zone, scan method, tool version, and important settings.
3. Result and reason: the state displayed by the tool and the corresponding packet or error response.
4. Cross-checking evidence: listening-service settings, application logs, firewall rules, and firewall logs.
5. Follow-up: differences between expected and observed results, the responsible person, and approved retesting arrangements.
Nmap's `--reason` option displays reasons for state classifications, helping document why a result entered a particular category; retaining original output also supports before-and-after comparisons. Nmap: output and classification reasons
For example:
“From the management test subnet, we used TCP SYN probes against port 443 on the test host, received SYN/ACK, and obtained an open classification. Next, we will check service settings and allowed sources against the change request and retain firewall logs from the same period.”
Separating observation, interpretation, and action makes the progress of verification easy to follow.
Move from test conditions to observation, cross-checking, and an approved next step.
The whole diagram scales proportionally to this column. Small screens also shrink its text; open the original SVG to zoom, or read the explanation below.
- How to read the diagram
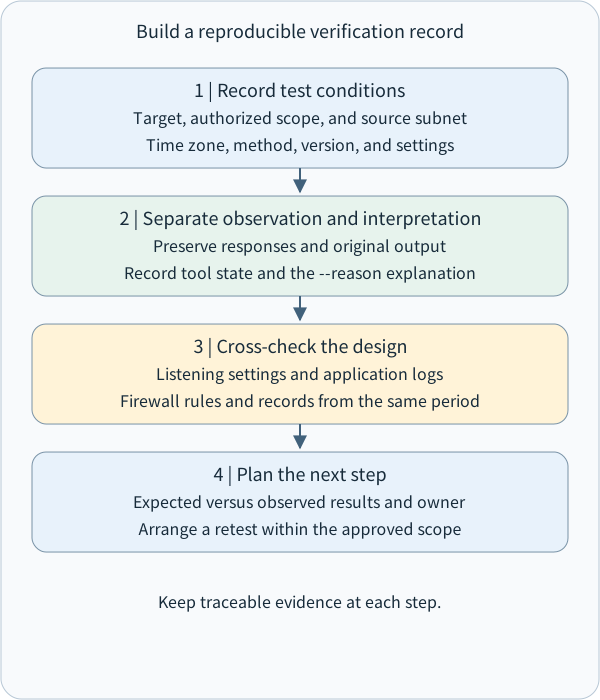
- Move from test conditions to observation, cross-checking, and an approved next step.
Arrows show the teaching sequence; each step has its stated conditions.
1 | Record test conditions
Target, authorized scope, and source subnet
Time zone, method, version, and settings
2 | Separate observation and interpretation
Preserve responses and original output
Record tool state and the --reason explanation
3 | Cross-check the design
Listening settings and application logs
Firewall rules and records from the same period
4 | Plan the next step
Expected versus observed results and owner
Arrange a retest within the approved scope
Keep traceable evidence at each step.
8 | Validate protection according to its design
From a protection perspective, organize checks into three layers:
- Service layer: every open entry point has a business purpose, a maintainer, and an update plan; disable unnecessary services.
- Access layer: configure rules around required sources and purposes; restrict management entry points to management subnets or approved channels.
- Validation layer: test separately from allowed and restricted observation locations, compare service settings and logs, and confirm that results match the design.
For example, a public website entry point and an administrator-only entry point have different policy objectives even when both are open. Judge whether a result meets requirements by considering the asset's purpose and access policy together.
This lesson practices reading synthetic output and designing verification records; actual probing follows the authorized scope, approved rate, and maintenance arrangements.
9 | Quick check: translate states into next steps
Try answering in your own words first:
1. The same TCP 443 tests open from the management subnet and filtered from another subnet. How would you explain these results, and what two kinds of evidence would you add?
2. What states commonly correspond to a TCP SYN probe receiving RST and a UDP probe receiving no response after retries, respectively?
3. When an ACK scan reports unfiltered, how would you check next whether the service is open?
4. A report says only “UDP 53 open|filtered.” Add at least four pieces of information that would help an administrator continue verification.
Today's takeaway: combine “observation location + scan method + response evidence + state + next step” to turn scan results into records that support validation and collaboration.
Next, M03-05 introduces service versions and banner information to understand what service an open entry point provides.
Reference answer: 1. One entry point, different locations
The two results describe access conditions for different sources: the management subnet's SYN probe receives a response accepting a connection, while probes from the other subnet show filtering. If policy permits only the management subnet, this is a lead for further validation. Add two categories of evidence: first, the service's listening and binding settings; second, firewall allow/deny rules and logs from the same period. Compare the source, time, and method together to check whether the results match the design.
Reference answer: 2. RST and UDP silence
A TCP SYN probe receiving RST is commonly classified as **closed**. A UDP probe still receiving no response after retries is commonly classified as **open|filtered**: the service may respond only to correctly formatted data, while path filtering can also produce silence. Preserve the original response evidence and test conditions, then check service and firewall records.
Reference answer: 3. The next step after unfiltered
An ACK scan's unfiltered result means that this probe receives a response; its focus is filtering behavior. Next, within the approved scope, use an appropriate method such as TCP SYN or Connect to observe whether a service accepts connections, and compare the device's listening settings. To establish the application's purpose, follow with an approved application-layer check.
Reference answer: 4. Complete the verification record
Add at least four items, such as the target IP address and approved purpose, source subnet, time and time zone, UDP scan method and tool version, waiting/retry settings, probe data format, original no-response output and classification reason, listening settings and DNS logs, or firewall rules and logs. Retain UDP 53's transport protocol and port number, and identify the next approved service-format query and responsible person so others can reproduce the test and continue the work.
Concept Q&A
Pending: related questions will be edited into anonymous teaching notes when available.