CEH M03-03 | TCP Connect, SYN and UDP Scanning
1 | The core idea
Port scanning sends probes to specified transport protocols and ports within an authorized scope, then interprets their responses as observations at that time. TCP Connect attempts to complete a TCP connection. SYN scanning examines the initial connection response. UDP scanning evaluates UDP replies, ICMP errors, and timeout results.
M03-02 asked which addresses show signs of activity. This lesson asks how particular TCP or UDP endpoints respond. The same number, such as 53/tcp and 53/udp, identifies two separately observed endpoints.
Imagine checking service desks in a building. You might complete registration, first ask whether registration is accepted, or submit a particular form and wait for a reply. Each method produces different evidence. All examples here use synthetic data and paper message flows. Choose actual operations later according to the authorized environment.
2 | Separate connections, services and scan results
A port is a numeric TCP or UDP field that helps the operating system deliver data to the appropriate communication endpoint. A listener indicates that a program is ready to receive communication at a particular address and port.
For example, a test server accepts TCP connections on port 443. After connection establishment, TLS negotiation and an HTTP request may follow. TLS is Transport Layer Security, protecting communication; HTTP is the request-and-response protocol commonly used by web applications. Login and authorization are subsequent application tasks.
Keep scan records in three layers:
- Raw observation: what was sent, what was received, and how long the tool waited.
- Tool interpretation: the method's reported state, such as open, closed, or filtered.
- Follow-up verification: actual service, configuration, purpose, and protection policy.
For now, open means the tool observed characteristics of accepted communication; closed means a corresponding closed or rejection response; filtered means filtering or related conditions prevent that method from determining whether the endpoint is open or closed. M03-04 examines these states and observation points in more detail. Nmap scan methods and results
3 | TCP Connect: ask the operating system to complete a connection
TCP, Transmission Control Protocol, commonly establishes a new connection through a three-way handshake:
1. The client sends SYN to request a connection and synchronize sequence information.
2. The server returns SYN+ACK, supplying its own synchronization information and acknowledging the client.
3. The client sends ACK to complete the handshake.
SYN abbreviates synchronize; ACK abbreviates acknowledgment. This describes a typical new connection. RFC 9293: TCP
A TCP Connect scan uses the operating system's connect call to attempt a connection to the specified IP address and TCP port, then reads the success or error result.
Paper example:
Test endpoint → 192.0.2.20:443: SYN
Server → test endpoint: SYN+ACK
Test endpoint → server: ACK
The operating system reports a successful connection; the tool then ends the test connection.
This uses the same connection interface available to ordinary applications. It answers whether a TCP connection can be established from the current location. A scan often ends at this point; service content, TLS, and website functions can be checked separately if the task requires them.
Nmap uses -sT for TCP Connect scanning. Because the connection completes, the service may log the connection or its immediate closure. Closure details vary by platform and service behavior. Nmap TCP Connect
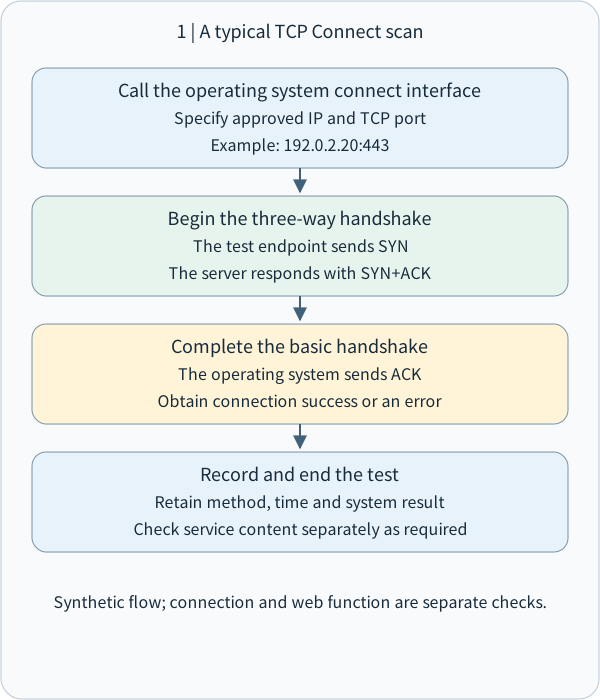
The operating system attempts a TCP connection, completes the handshake and reports the result; the tool then ends the test connection.
The whole diagram scales proportionally to this column. Small screens also shrink its text; open the original SVG to zoom, or read the explanation below.
- How to read the diagram
- The operating system attempts a TCP connection, completes the handshake and reports the result; the tool then ends the test connection.
Arrows show the teaching sequence; each step has its stated conditions.
Call the operating system connect interface
Specify approved IP and TCP port
Example: 192.0.2.20:443
Begin the three-way handshake
The test endpoint sends SYN
The server responds with SYN+ACK
Complete the basic handshake
The operating system sends ACK
Obtain connection success or an error
Record and end the test
Retain method, time and system result
Check service content separately as required
Synthetic flow; connection and web function are separate checks.
4 | SYN scanning: interpret the initial handshake response
A SYN scan directly examines the response to an initial TCP packet. In a typical open-port case, the test endpoint sends SYN, receives SYN+ACK, and ends the attempt with RST instead of completing the normal handshake.
RST, reset, is a TCP control flag used to reset connection state. This approach is often called half-open scanning, describing how it handles the handshake.
Paper example:
Test endpoint → 192.0.2.20:443: SYN
Server → test endpoint: SYN+ACK
Test endpoint → server: RST
The tool interprets SYN+ACK as an open TCP endpoint.
A corresponding RST reply normally produces a closed result for a SYN scan. No response after retries, or certain ICMP unreachable messages, may produce filtered. Record the probe method and response source alongside the interpretation.
Nmap uses -sS for SYN scanning. It normally requires facilities and privileges to send and receive raw packets. Actual requirements depend on the operating system, packet driver, and execution environment. Nmap SYN scanning
Some materials use the historical term stealth. Interpret that as a difference in handshake and possible application-log behavior compared with a complete connection. Firewalls and intrusion detection/prevention systems (IDS/IPS) can still detect probe patterns, sources, and frequency. Prioritize authorization, compatibility, and the evidence required when selecting a method.
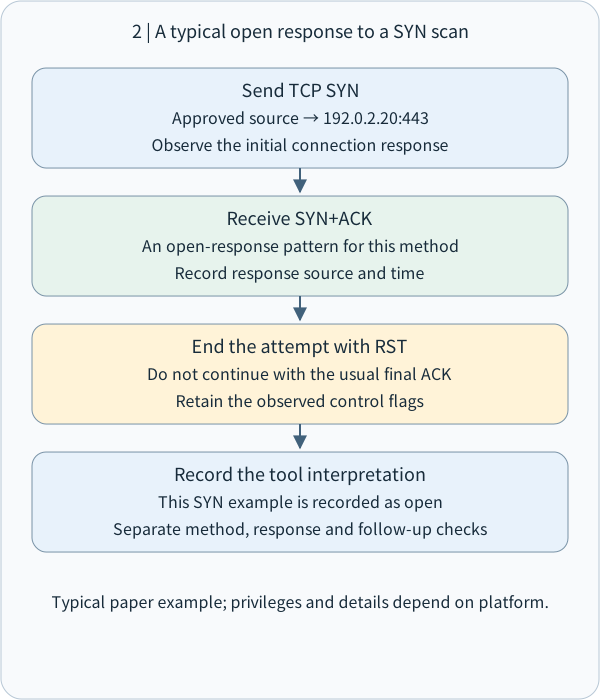
A SYN scan examines the initial response; in a typical open case, SYN+ACK is followed by RST to end the attempt.
The whole diagram scales proportionally to this column. Small screens also shrink its text; open the original SVG to zoom, or read the explanation below.
- How to read the diagram
- A SYN scan examines the initial response; in a typical open case, SYN+ACK is followed by RST to end the attempt.
Arrows show the teaching sequence; each step has its stated conditions.
Send TCP SYN
Approved source → 192.0.2.20:443
Observe the initial connection response
Receive SYN+ACK
An open-response pattern for this method
Record response source and time
End the attempt with RST
Do not continue with the usual final ACK
Retain the observed control flags
Record the tool interpretation
This SYN example is recorded as open
Separate method, response and follow-up checks
Typical paper example; privileges and details depend on platform.
5 | UDP scanning: interpret datagrams and error reports
UDP, User Datagram Protocol, sends datagrams and has no TCP-style SYN, SYN+ACK, ACK handshake. Applications determine how to process and reply to received messages under their own protocols. RFC 768: UDP
For example, a DNS (Domain Name System) service may answer a correctly formatted query and handle unsuitable data differently. UDP results therefore depend on the payload—the data carried by the message. Record what was sent together with the response or waiting result.
Nmap uses -sU for UDP scanning. Common interpretations include:
- A corresponding UDP reply from the target port: open.
- IPv4 ICMP Type 3, Code 3, meaning port unreachable: closed.
- Certain other ICMP unreachable errors: filtered.
- No response after retries: open|filtered.
The vertical bar in open|filtered preserves the alternatives of open or filtered. Appropriate application probes or device configuration records may narrow the explanation. Nmap UDP scanning
ICMP, Internet Control Message Protocol, is a separate control-message protocol. An ICMP response triggered by a UDP probe is an error report from a network device or host. Check its source and the original probe it references. The type/code numbers above apply to IPv4; ICMPv6 has its own definitions. RFC 792: ICMP
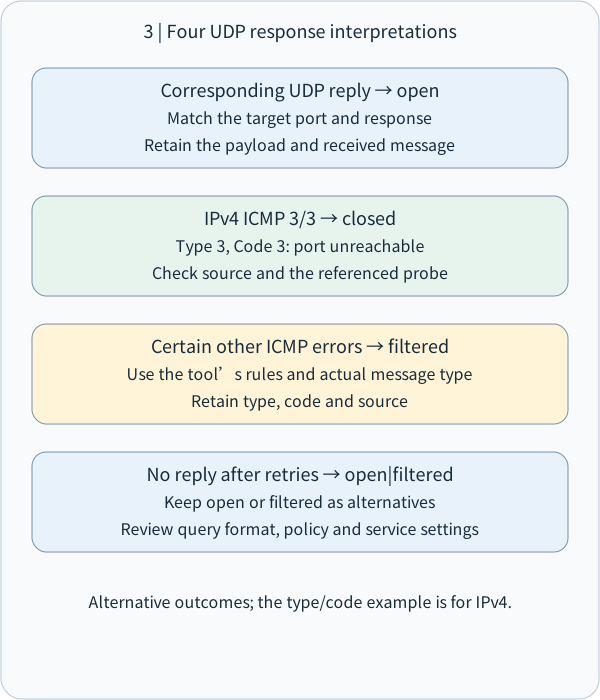
Four parallel cards show alternative outcomes: UDP replies, ICMP errors and timeouts map to method-specific states.
The whole diagram scales proportionally to this column. Small screens also shrink its text; open the original SVG to zoom, or read the explanation below.
- How to read the diagram
- Four parallel cards show alternative outcomes: UDP replies, ICMP errors and timeouts map to method-specific states.
Parallel cards compare categories; their order does not imply a process.
Corresponding UDP reply → open
Match the target port and response
Retain the payload and received message
IPv4 ICMP 3/3 → closed
Type 3, Code 3: port unreachable
Check source and the referenced probe
Certain other ICMP errors → filtered
Use the tool’s rules and actual message type
Retain type, code and source
No reply after retries → open|filtered
Keep open or filtered as alternatives
Review query format, policy and service settings
Alternative outcomes; the type/code example is for IPv4.
6 | Why waiting time, rate and observation point matter
Observing a service from an internal network, a guest network, or an external test location may traverse different policies. Firewalls handle traffic according to rules. Load balancers, proxies, and NAT—Network Address Translation—can also change the actual response path.
Think of a scan as a snapshot from a particular observation point. Record source, destination IP, TCP/UDP, port, and time to determine whether two tests are comparing the same conditions.
UDP often requires patience. A service may answer only valid queries, packets may be lost, and a host may rate-limit ICMP error messages. Tools wait and retry before interpreting the outcome under their settings. Nmap's UDP documentation discusses the effect of ICMP rate limiting on scan duration. Nmap UDP interpretation and duration
Speed is therefore one consideration among several. Start with a small set of approved endpoints, define waits and stopping conditions, and account for maintenance windows and device capacity. Retain tool versions, options, and test conditions when results will be compared.
7 | Worked example: three observations of one test host
These are synthetic records, not actual scan output. Assume authorization to examine 192.0.2.20 in an isolated laboratory.
Record A: a Connect test to TCP/443 returns an operating-system report of successful connection establishment.
Record B: a SYN sent to TCP/443 receives SYN+ACK, followed by a test-endpoint RST.
Record C: a test datagram sent to UDP/53 receives no reply within the approved waiting and retry configuration.
For A, write: “At this time and source location, a TCP/443 connection could be established. Website-service checks are tracked separately.”
For B, write: “TCP/443 responded to SYN with SYN+ACK and is recorded as open under this method. Retain the reset and termination details.”
For C, write: “UDP/53 returned no corresponding reply in this test and is recorded as open|filtered under this method. Next, check approved query format, UDP policy, and service configuration.”
If C later receives IPv4 ICMP Type 3, Code 3, append the new observation and timestamp and record closed for that response. Retain the previous entry to show changes in response, configuration, or time.
One address has multiple protocol endpoints, and the same TCP endpoint can be examined by different methods. Explicit methods and evidence make each conclusion understandable to the team.
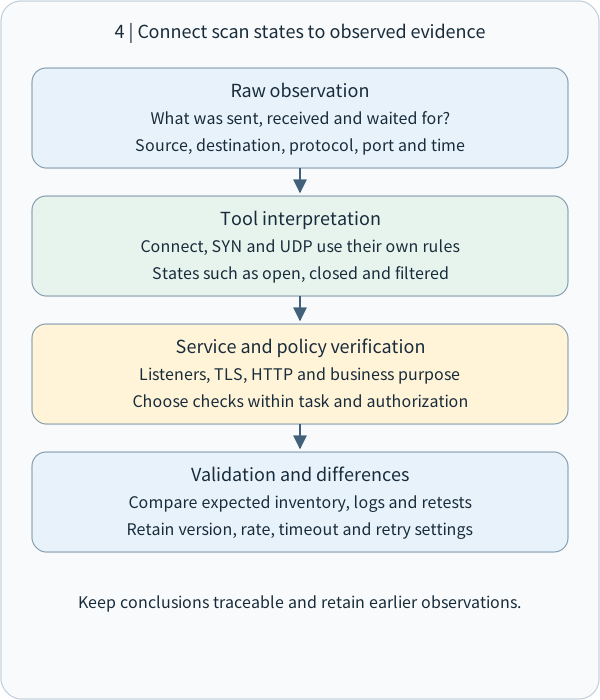
Record probes and responses, then tool interpretation; verify services and policy as needed and retain test conditions and differences.
The whole diagram scales proportionally to this column. Small screens also shrink its text; open the original SVG to zoom, or read the explanation below.
- How to read the diagram
- Record probes and responses, then tool interpretation; verify services and policy as needed and retain test conditions and differences.
Arrows show the teaching sequence; each step has its stated conditions.
Raw observation
What was sent, received and waited for?
Source, destination, protocol, port and time
Tool interpretation
Connect, SYN and UDP use their own rules
States such as open, closed and filtered
Service and policy verification
Listeners, TLS, HTTP and business purpose
Choose checks within task and authorization
Validation and differences
Compare expected inventory, logs and retests
Retain version, rate, timeout and retry settings
Keep conclusions traceable and retain earlier observations.
8 | Method selection and control validation
Choose a method through three questions.
First, what needs confirming? Connect illustrates ordinary TCP connection establishment. SYN examines initial TCP responses. UDP service inventory requires an appropriate UDP observation for the service.
Second, what does the environment permit? Confirm sources, targets, ports, privileges, time window, rates, owner, and stopping conditions. Complete connections and small probe sets can both leave records and consume resources. Match the plan to device characteristics.
Third, how will the result be validated? Compare observations with the intended open-port list, service listeners, network policy, and relevant logs. Assign unexpected exposure to the service owner to confirm its purpose, then use approved changes and retesting.
A synthetic acceptance record could say: “The test network's TCP/443 connection matches expectations. The owner is verifying UDP/53 purpose and policy. Both retain raw responses, configuration evidence, and retest times.”
An IDS, Intrusion Detection System, can observe scan patterns. An IPS, Intrusion Prevention System, can block according to its deployment and policy. Compare alerts with traffic records to determine how monitoring recognizes an approved test. This connects to M12's monitoring concepts while keeping the established reading order.
9 | Checks and the takeaway
Answer in your own words first. Reference answers accompany the website material.
1. After receiving SYN+ACK, how do typical Connect and SYN scans differ?
2. Why preserve open|filtered when a UDP probe receives no reply after retries? Give two possible explanations.
3. A TCP/443 connection succeeds. What additional layer of evidence is needed to confirm that the website serves the expected page?
4. Two reports disagree about the same IP. Which test conditions would you compare first? List at least three.
Take away three ideas: Connect attempts a complete TCP connection; SYN interprets the initial handshake response; UDP combines datagram replies, ICMP, and waiting results.
Link every state to where, when, which method, and what response. M03-04 next examines the meaning and interpretation of open, closed, filtered, and related states.
Reference answer: Check 1
Connect lets the operating system send ACK and complete the typical handshake; the tool then ends the test connection after obtaining its result. A SYN scan normally sends RST after SYN+ACK, ending the attempt and interpreting that initial response as open. Retain the method and actual packet or system results for each.
Reference answer: Check 2
A listening service may reply only to suitable requests, or a firewall may filter the probe or return traffic. Packet loss and error-message rate limiting are additional factors to investigate. Preserve open|filtered and review payload, waits, retries, policy, and service records.
Reference answer: Check 3
Add application-service evidence. For HTTPS, check the TLS channel and certificate result, then the HTTP response and expected page content. Include login or authorization checks when the task requires and authorizes them. Record time, method, and result at each layer.
Reference answer: Check 4
Compare at least three of: source location/network, time, TCP versus UDP, destination port, scan method, tool version, wait/retry settings, rate, and payload. Also check NAT/proxy paths and contemporaneous firewall/listener settings. Establish comparable conditions and retain the differences and raw responses for investigation.
Concept Q&A
Pending: related questions will be edited into anonymous teaching notes when available.